Cataloging the Global Diversity of the Human Gut Microbiome
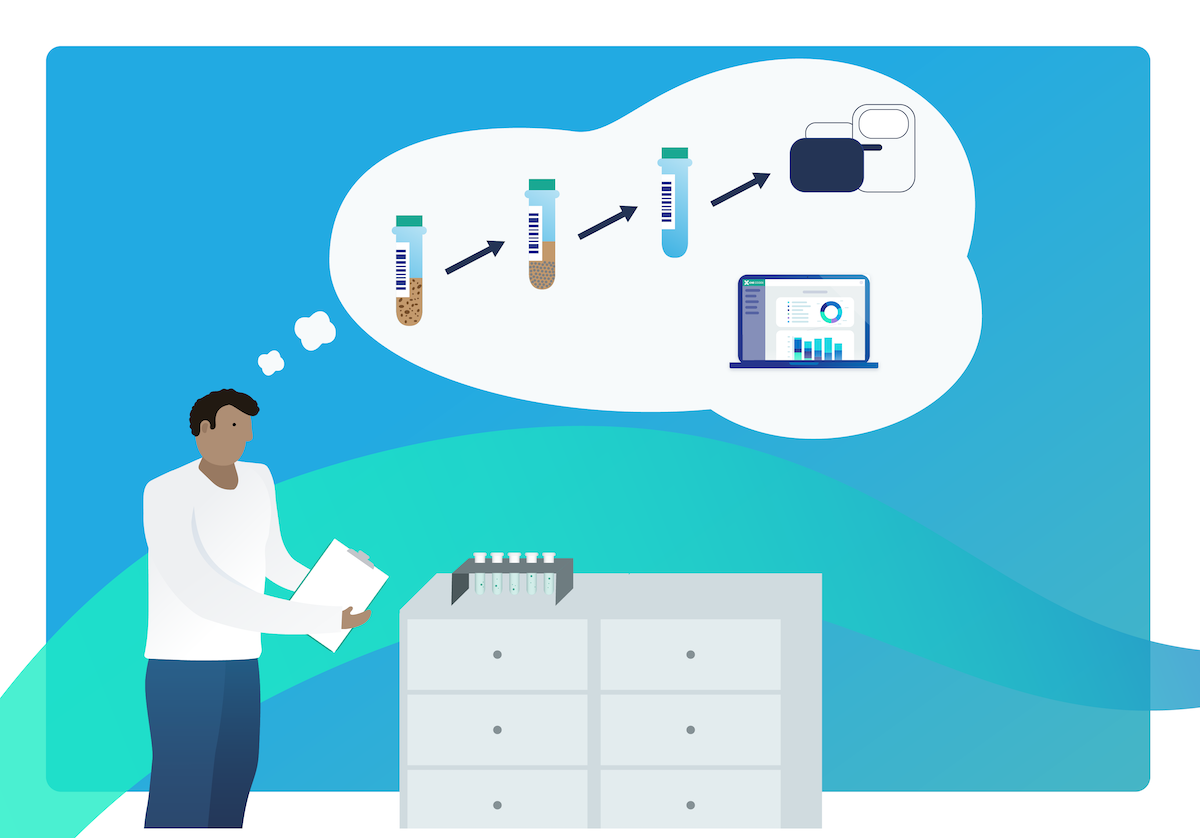
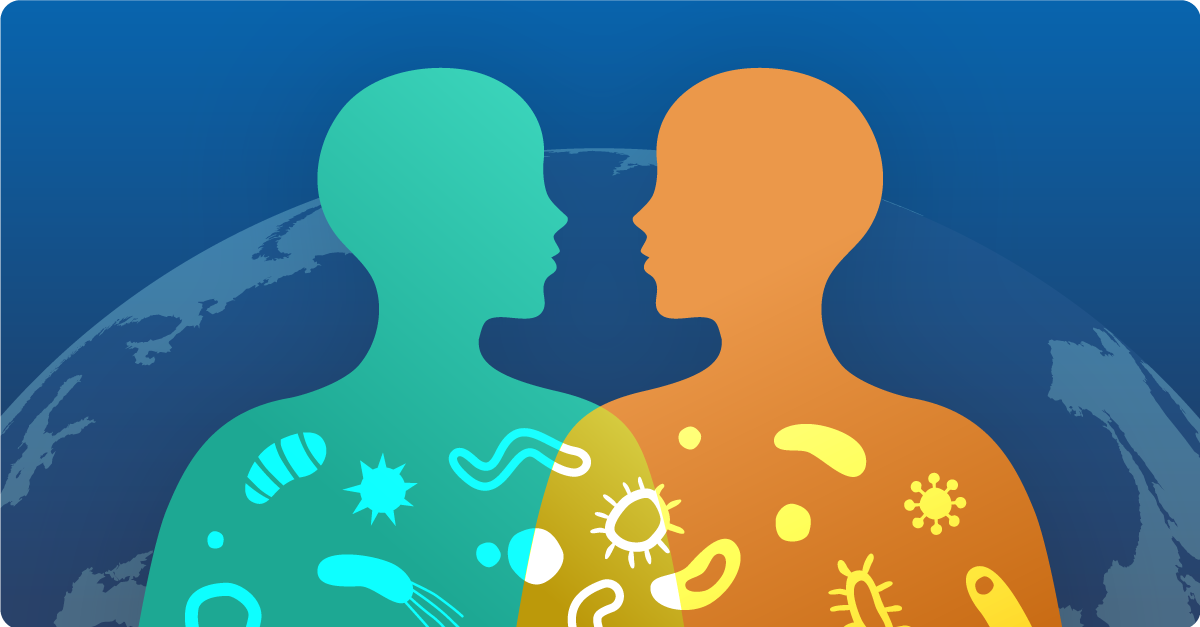
The microbial communities that inhabit our bodies can be thought of as unique fingerprints that both reflect and help determine many aspects of our health. Currently, metagenomic sequencing offers the best window we have into our microbiomes, which are primarily composed of uncultivated organisms. However, despite important insights gained from 20+ years of sequencing human microbiomes, it is estimated that 40-50% of species in the human gut microbiome lack reference genomes (Nayfach et al, 2019, Nature). Science is still trying to answer the question of who lives in our guts, what differences exist between people, and the underlying mechanisms behind these differences.