Interactive Microbiome Analysis With One Codex
Today, we’re very excited to launch a brand new feature on One Codex that lets you analyze your microbiome data in all new and exciting ways! Custom Plots is a powerful new application for interactively comparing and visualizing your microbiome data across cohorts of many samples.
With Custom Plots, you can explore a variety of different microbiome metrics and plots that were previously only accessible through our Notebooks. This includes taxonomic bar charts (like our current “Quick Compare” tool), alpha diversity plots, and beta diversity plots like heatmaps or Principal Coordinate Analyses (PCoA).
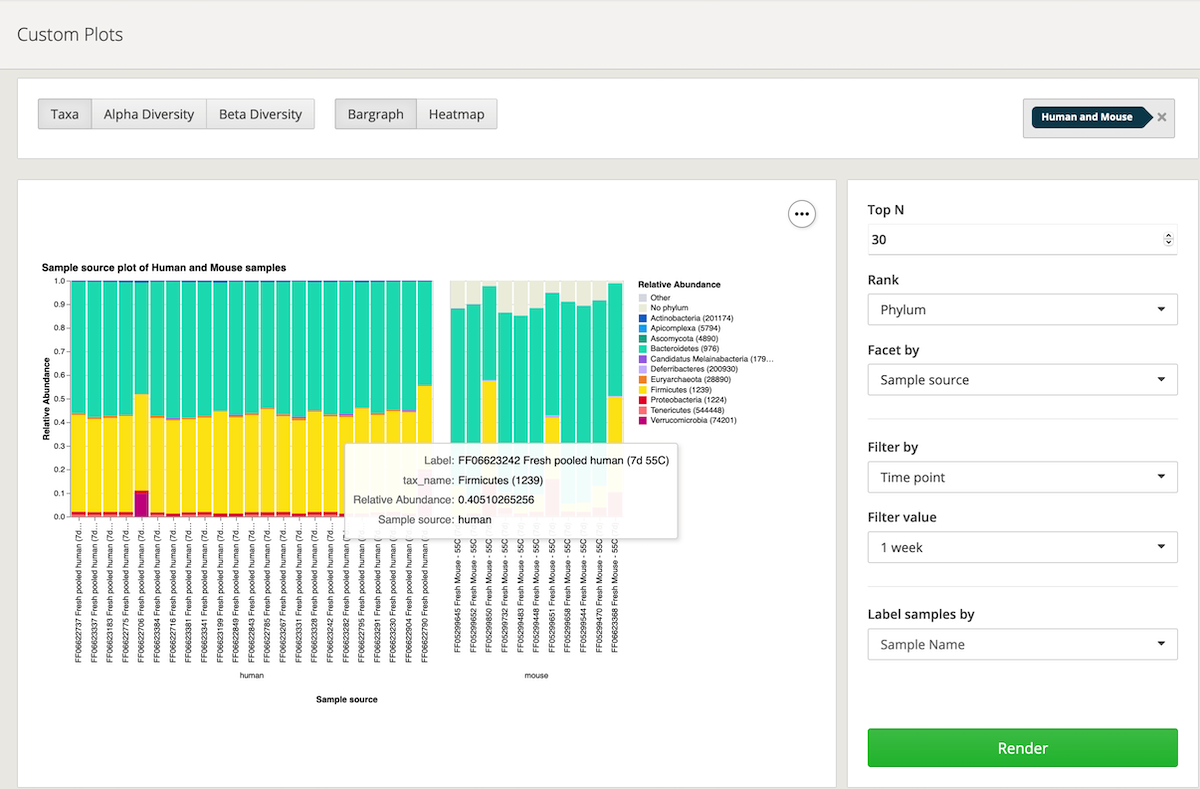
Custom Plots are tightly integrated with the rest of One Codex. That means you can easily select which samples you’d like to analyze based on Projects or Tags. From there you can group, label, and facet your plots using the Metadata you’ve added to your samples. This will help you answer your research questions more easily than ever before. And every plot you create can be exported as a publication-ready PNG or SVG file.
We’ve put together comprehensive documentation to help you get started with Custom Plots today. We’ll be releasing lots more examples and guides over the next little while, so be sure to subscribe to our blog to stay updated!