Sample comparison tool
Today we’re launching our new sample comparison tool on the One Codex Beta Platform.
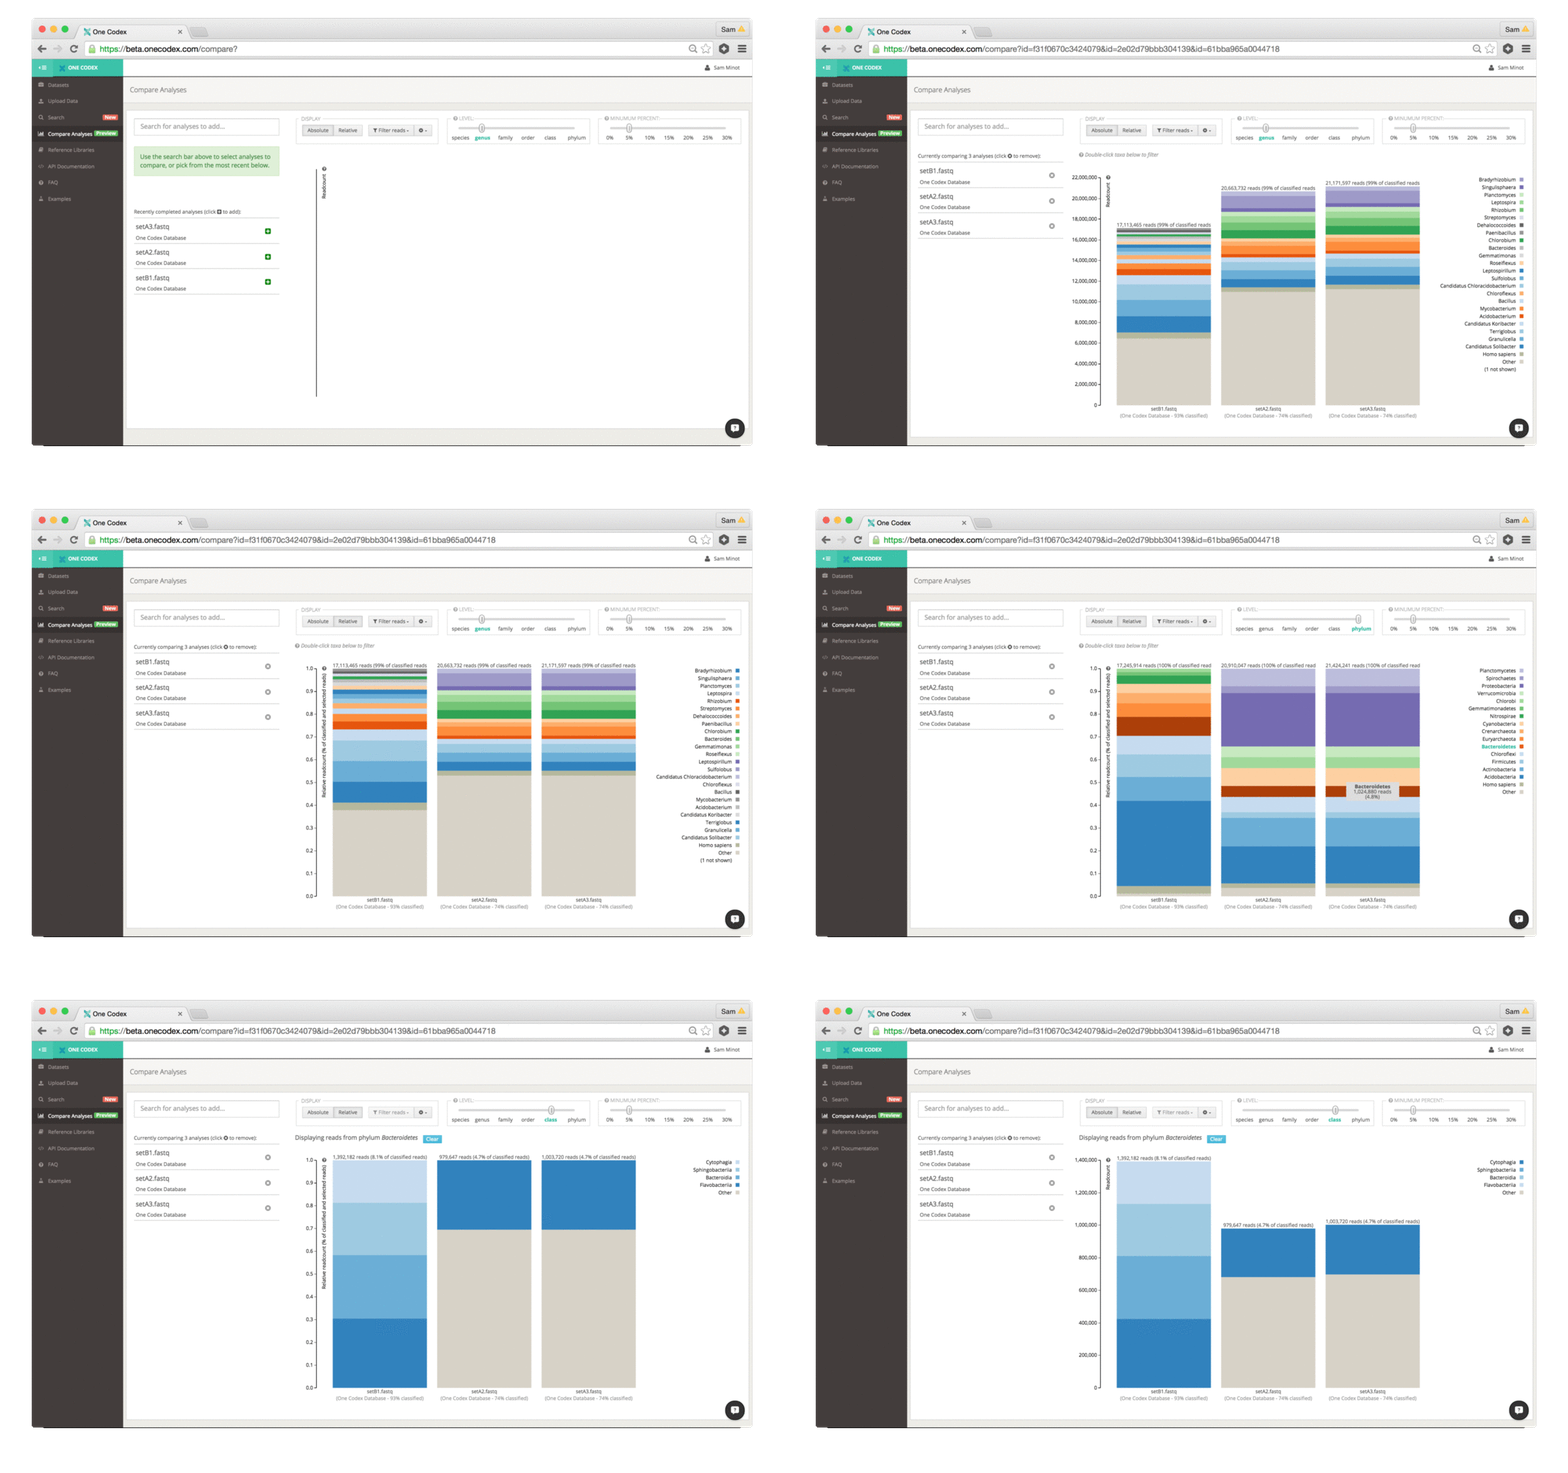
The tool enables quick selection and comparison of any of your samples and displays the abundance of taxonomic groups in each sample as a stacked bar graph:

The comparison view supports large side-by-side comparisons, viewing data at a particular taxonomic level and/or abundance, filtering to specific clades, and relative vs. absolute scaling modes.
See an example and try out the tool here
How it works:
1) Add samples: Select your datasets from the recently completed samples list, or use the search bar to look for a sample directly.
2) Adjust the display: The two control sliders can be used to select the taxonomic level of categorization as well as the minimum percent abundance cutoff. Taxonomic groups with abundance lower than the minimum percent abundance cutoff are displayed as the Other group. You can also select and whether the absolute number of reads or the relative proportion of reads is displayed.
3) Select a particular taxonomic group: Double-clicking any taxonomic group in the bargraph “zooms” the comparison to that group for comparison within the group only.
4) Filter out unwanted clades: Use the Filter Reads dropdown menu to select or de-select reads from bacteria, viruses, fungi and archaea, as well as the host.
Your feedback & questions
We’d love to hear if you find this functionality useful, whether you’d like to see any additional features, and any questions you may have. As always, please feel free to drop us a note, follow us on Twitter, or chat with us directly on the site.