Academic Study Data Shows One Codex’s Superior Performance for Metagenomic Analysis
When analyzing microbiome data, it’s very important to know that you are detecting the microbes that are truly present and that the predicted abundances are accurate.1 However, it can be a lot of work to test and validate microbiome analysis tools across a wide range of conditions. We are very grateful to a group of academic researchers from Weill Cornell Medicine, UC-Riverside, IBM, University of Vermont, HudsonAlpha, & Drexel University who performed those evaluations and contributed them to the community. Today we’re happy to present some results from an independent academic evaluation.2 Using the same datasets and accuracy metrics shows the performance of One Codex is superior to a range of other tools for microbiome analysis.
The Study
A group of academic researchers led by Prof. Chris Mason at the Weill Cornell Medical School assembled a wide range of microbiome analysis tools and a large number of testing datasets. Each dataset was made up of a known collection of microbes, so all of the results could be evaluated for their accuracy. All of the 35 datasets in this study were whole-genome shotgun (WGS) sequencing datasets (both in silico and lab constructed).
Every tool was evaluated for both its detection accuracy and relative abundance estimation. For this evaluation, the following metrics were used:
- Precision: Out of all of the organisms detected, the proportion that are truly present.
- Recall: Out of all of the organisms truly in the sample, the proportion that were detected.
- F1: The harmonic mean of Precision and Recall
- AUPR: The area under the precision-recall curve, summarizing the value of a confidence metric (e.g., abundance) for improving detection accuracy
- Deviation: The difference between the predicted and actual organism abundance
- L1 distance: A distance measure summarizing abundance estimate deviations at the dataset-level (lower is better)
The Results: Detection Accuracy
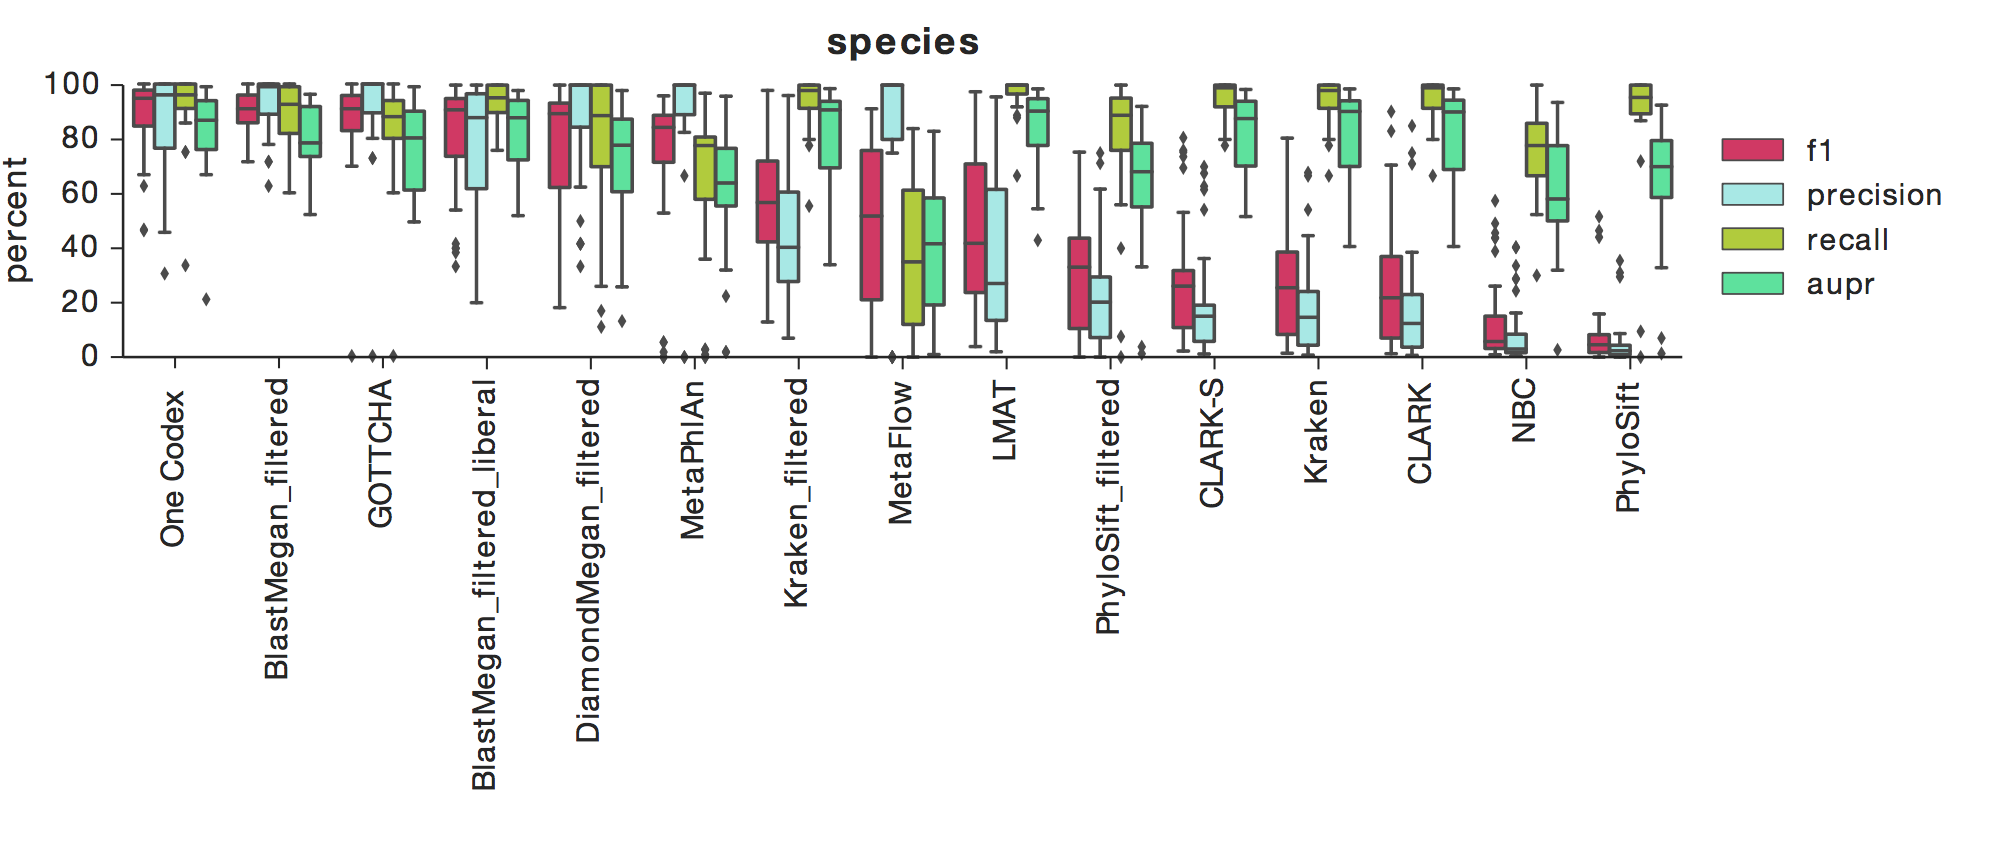
The above figure shows F1, Precision, Recall, and AUPR across a number of tools, with box-whisker plots showing the median and quartiles for each metric across all 35 datasets. One Codex had the highest median F1 score across all datasets at the species level, which indicates a high degree of both precision and recall (results are similar at the genus-level).
The Results: Relative Abundance Estimation
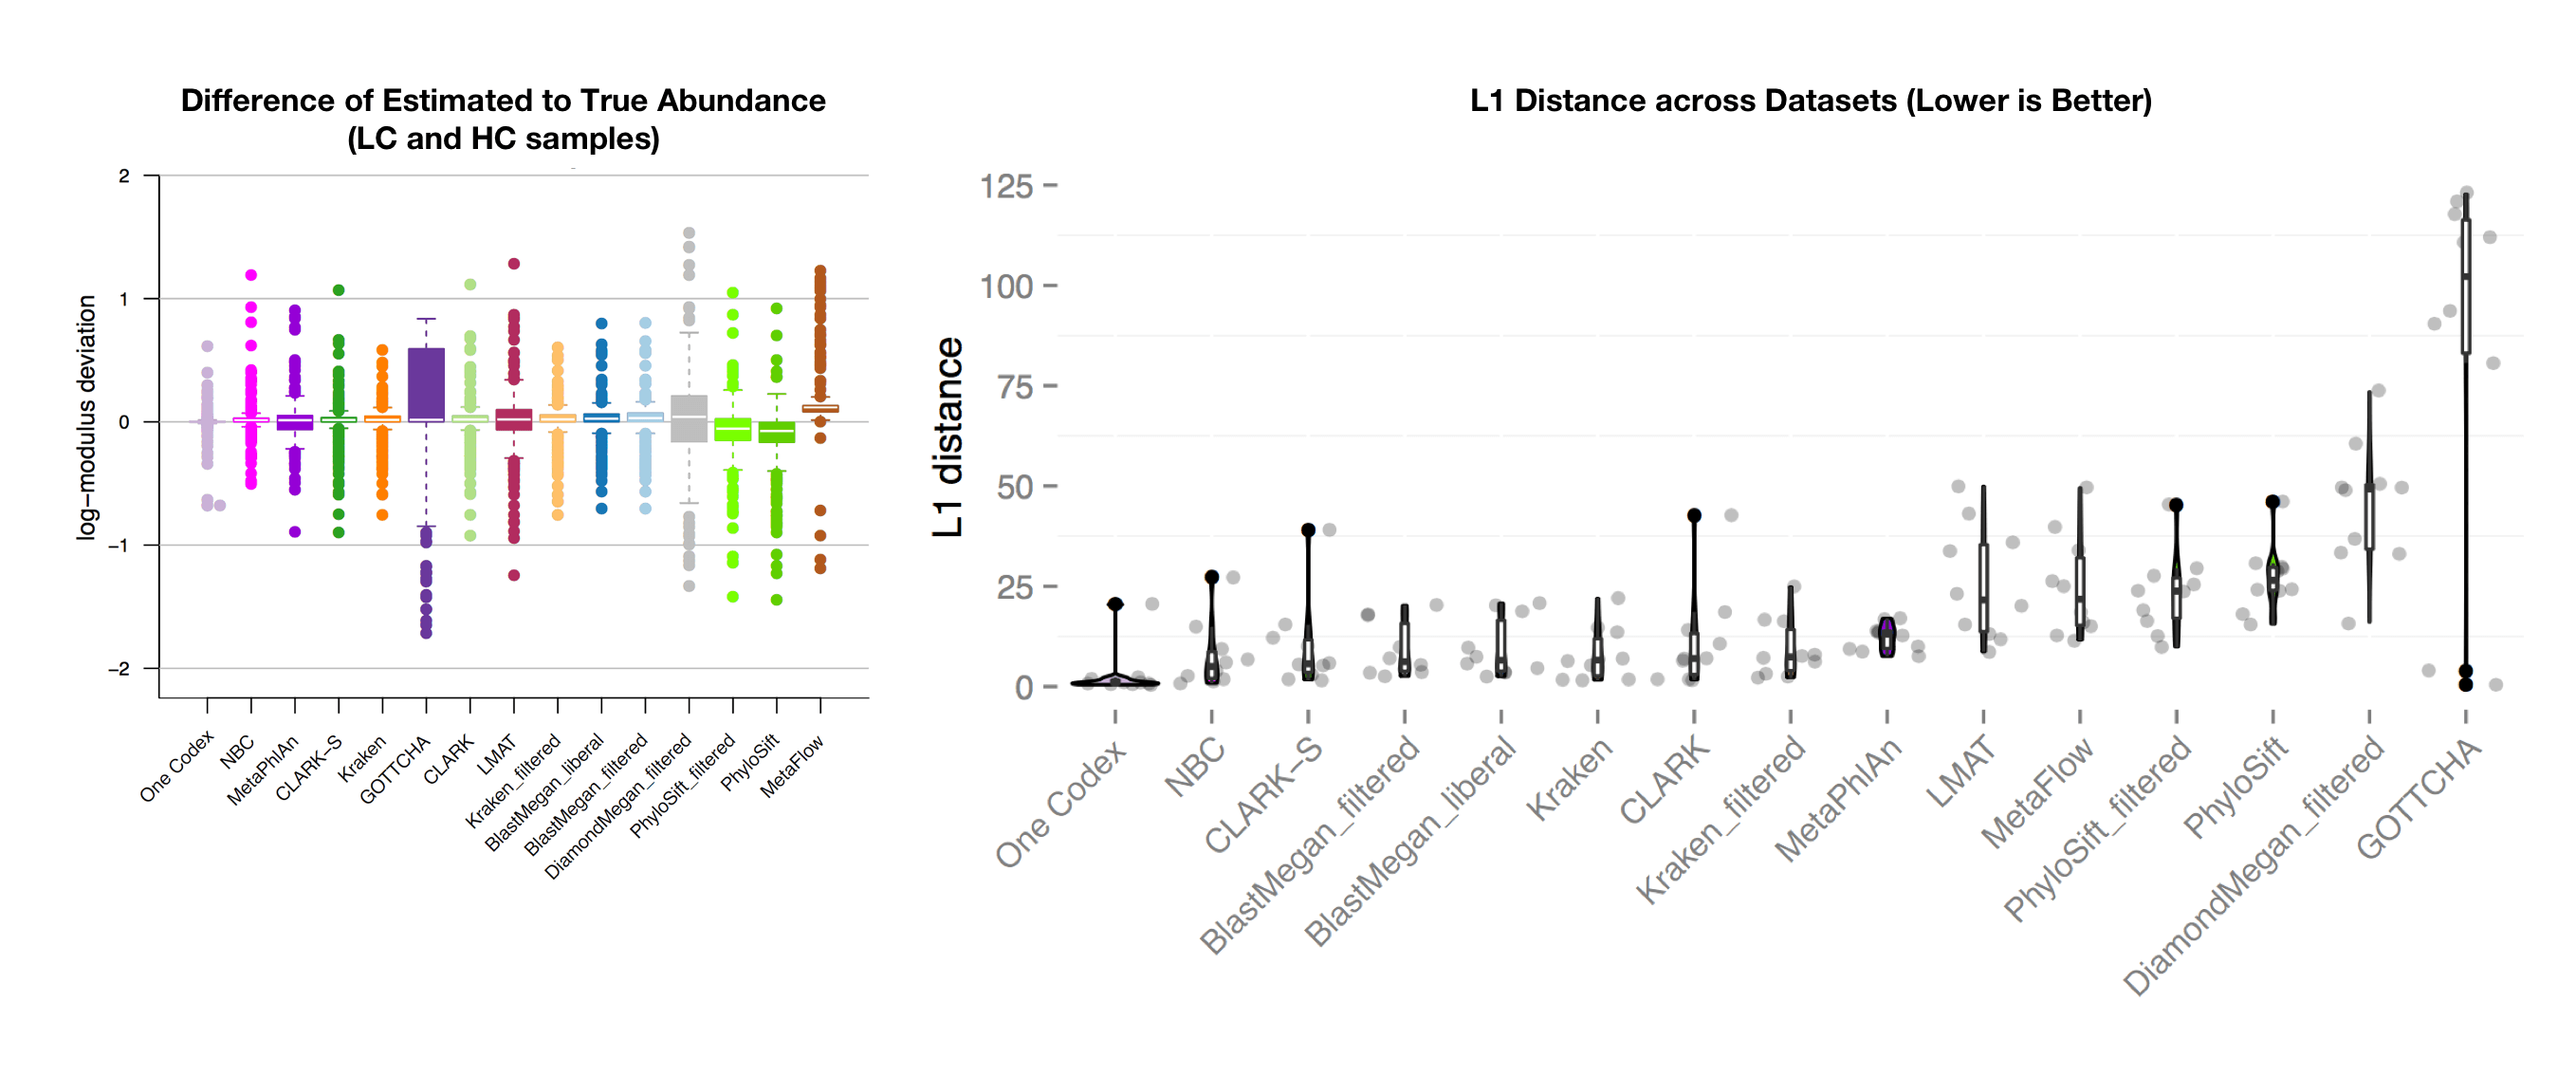
The above figure (left) shows the accuracy of abundance prediction across all of the tools, with a value of 0 indicating an exact match between the actual and predicted abundance. One Codex had the most accurate prediction of organism abundance in this analysis, with very little deviation from the true abundance. The righthand figure shows the distribution of L1 distances across the 35 test datasets (lower is better). Note that the One Codex results have a single outlier and are otherwise tightly clustered around 0.
Beyond Accuracy: One Codex’s Other Key Features
While getting accurate results is fundamental to good microbiome analysis (One Codex also has the largest database of whole genomes), the One Codex platform is also notable for its speed and ease of use.
In the context of the above evaluation, One Codex completed analyses 3 orders of magnitude faster than BLAST-Megan, the tool with the next highest performance. In practice, this is the difference between minutes and days is the difference between exhaustively classifying all data from a sequencing run and having to subsample and throw away data to complete analyses in a reasonable timeframe. In terms of ease of use, One Codex offers a graphical user interface (GUI) supporting taxonomic and functional analysis of metagenomic WGS, 16S, and other sequencing data, in addition to a full-featured API and command line tool.
If you’re interested in learning more about One Codex, please send us a message here or write us an email.
1 Accurate relative abundance estimation is especially critical for downstream analyses that make use of community composition metrics which are sensitive to these relative measures, e.g., Simpson's index
2 For more details on the datasets and methods used in this evaluation, please take a look at the preprint on bioRxiv. The final submission ended up using only open source tools, but the figures above were produced using the same set of datasets and analysis as the published data. Note that while we were involved in putting together the publication, we had no role in selecting the datasets that were used for this study.